The Mad Hatter’s Guide to Data Viz and Stats in R
    • Data Viz and Stats
      • Tools
        • Introduction to R and RStudio
      • Studio Flow and Data Kits
        • 12-Day Studio Index
        • Healthcare Data Kits
      • Descriptions
        • Data
        • Inspect Data
        • Graphs
        • Summaries
        • Counts
        • Quantities
        • Groups
        • Distributions
        • Groups and Distributions
        • Change
        • Proportions
        • Hierarchy
        • Evolution and Flow
        • Ratings and Rankings
        • Surveys
        • Time
        • Space
          • Introduction to Maps
          • What is Vector Data?
          • The Grammar of Maps
          • Interactive Maps with leaflet
        • Networks
        • Miscellaneous Graphing Tools, and References
      • Inference
        • Basics
        • 🎲 Samples
        • Randomization
        • One Mean
        • Two Independent Means
        • Two Paired Means
        • Multiple Means (ANOVA)
        • Correlation
        • One Proportion
        • Two Proportions
      • Modelling
        • Modelling with Linear Regression
        • Modelling with Logistic Regression
        • 🕔 Modelling and Predicting Time Series
      • Workflow
        • Facing the Abyss
        • I Publish, therefore I Am
        • Data Carpentry
      • Arts
        • Colours
        • Fonts
        • Annotations
        • More Annotations
        • Highlighting
        • Scales
      • AI Tools
        • Using gander and ellmer
        • Using Github Copilot and other AI tools to generate R code
        • Using LLMs to Explain Stat models
      • Case Studies
        • Demo:Product Packaging and Elderly People
        • Ikea Furniture
        • Movie Profits
        • Gender at the Work Place
        • Heptathlon
        • School Scores
        • Children’s Games
        • Valentine’s Day Spending
        • Women Live Longer?
        • Hearing Loss in Children
        • California Transit Payments
        • Seaweed Nutrients
        • Coffee Flavours
        • Legionnaire’s Disease in the USA
        • Antarctic Sea ice
        • William Farr’s Observations on Cholera in London
      • Projects
        • No Free Hunch

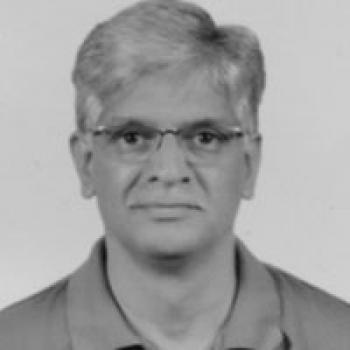
    Hi, I’m Arvind Venkatadri.

    I’m external Faculty at the Srishti Manipal Institute of Art and Design, both in Bangalore, INDIA, and a Certified Level #1 TRIZ Professional.

    I have a passion for coding in R / ObservableJS / p5.js, Data Visualization, Complexity Science, Literature, and Creative Thinking / Problem Solving with TRIZ.

    On this website, I share and teach Data Visualization and Statistics in the R language.

    To get started, you can check out my courses. You can also find me on Twitter, GitHub, and on Medium. Feel free to reach out to me via email !

    Back to top

    License: CC BY-SA 2.0

    Website made with ❤️ and Quarto, by Arvind V.

    Hosted by Netlify .