1 Setting up R Packages
2 Introduction
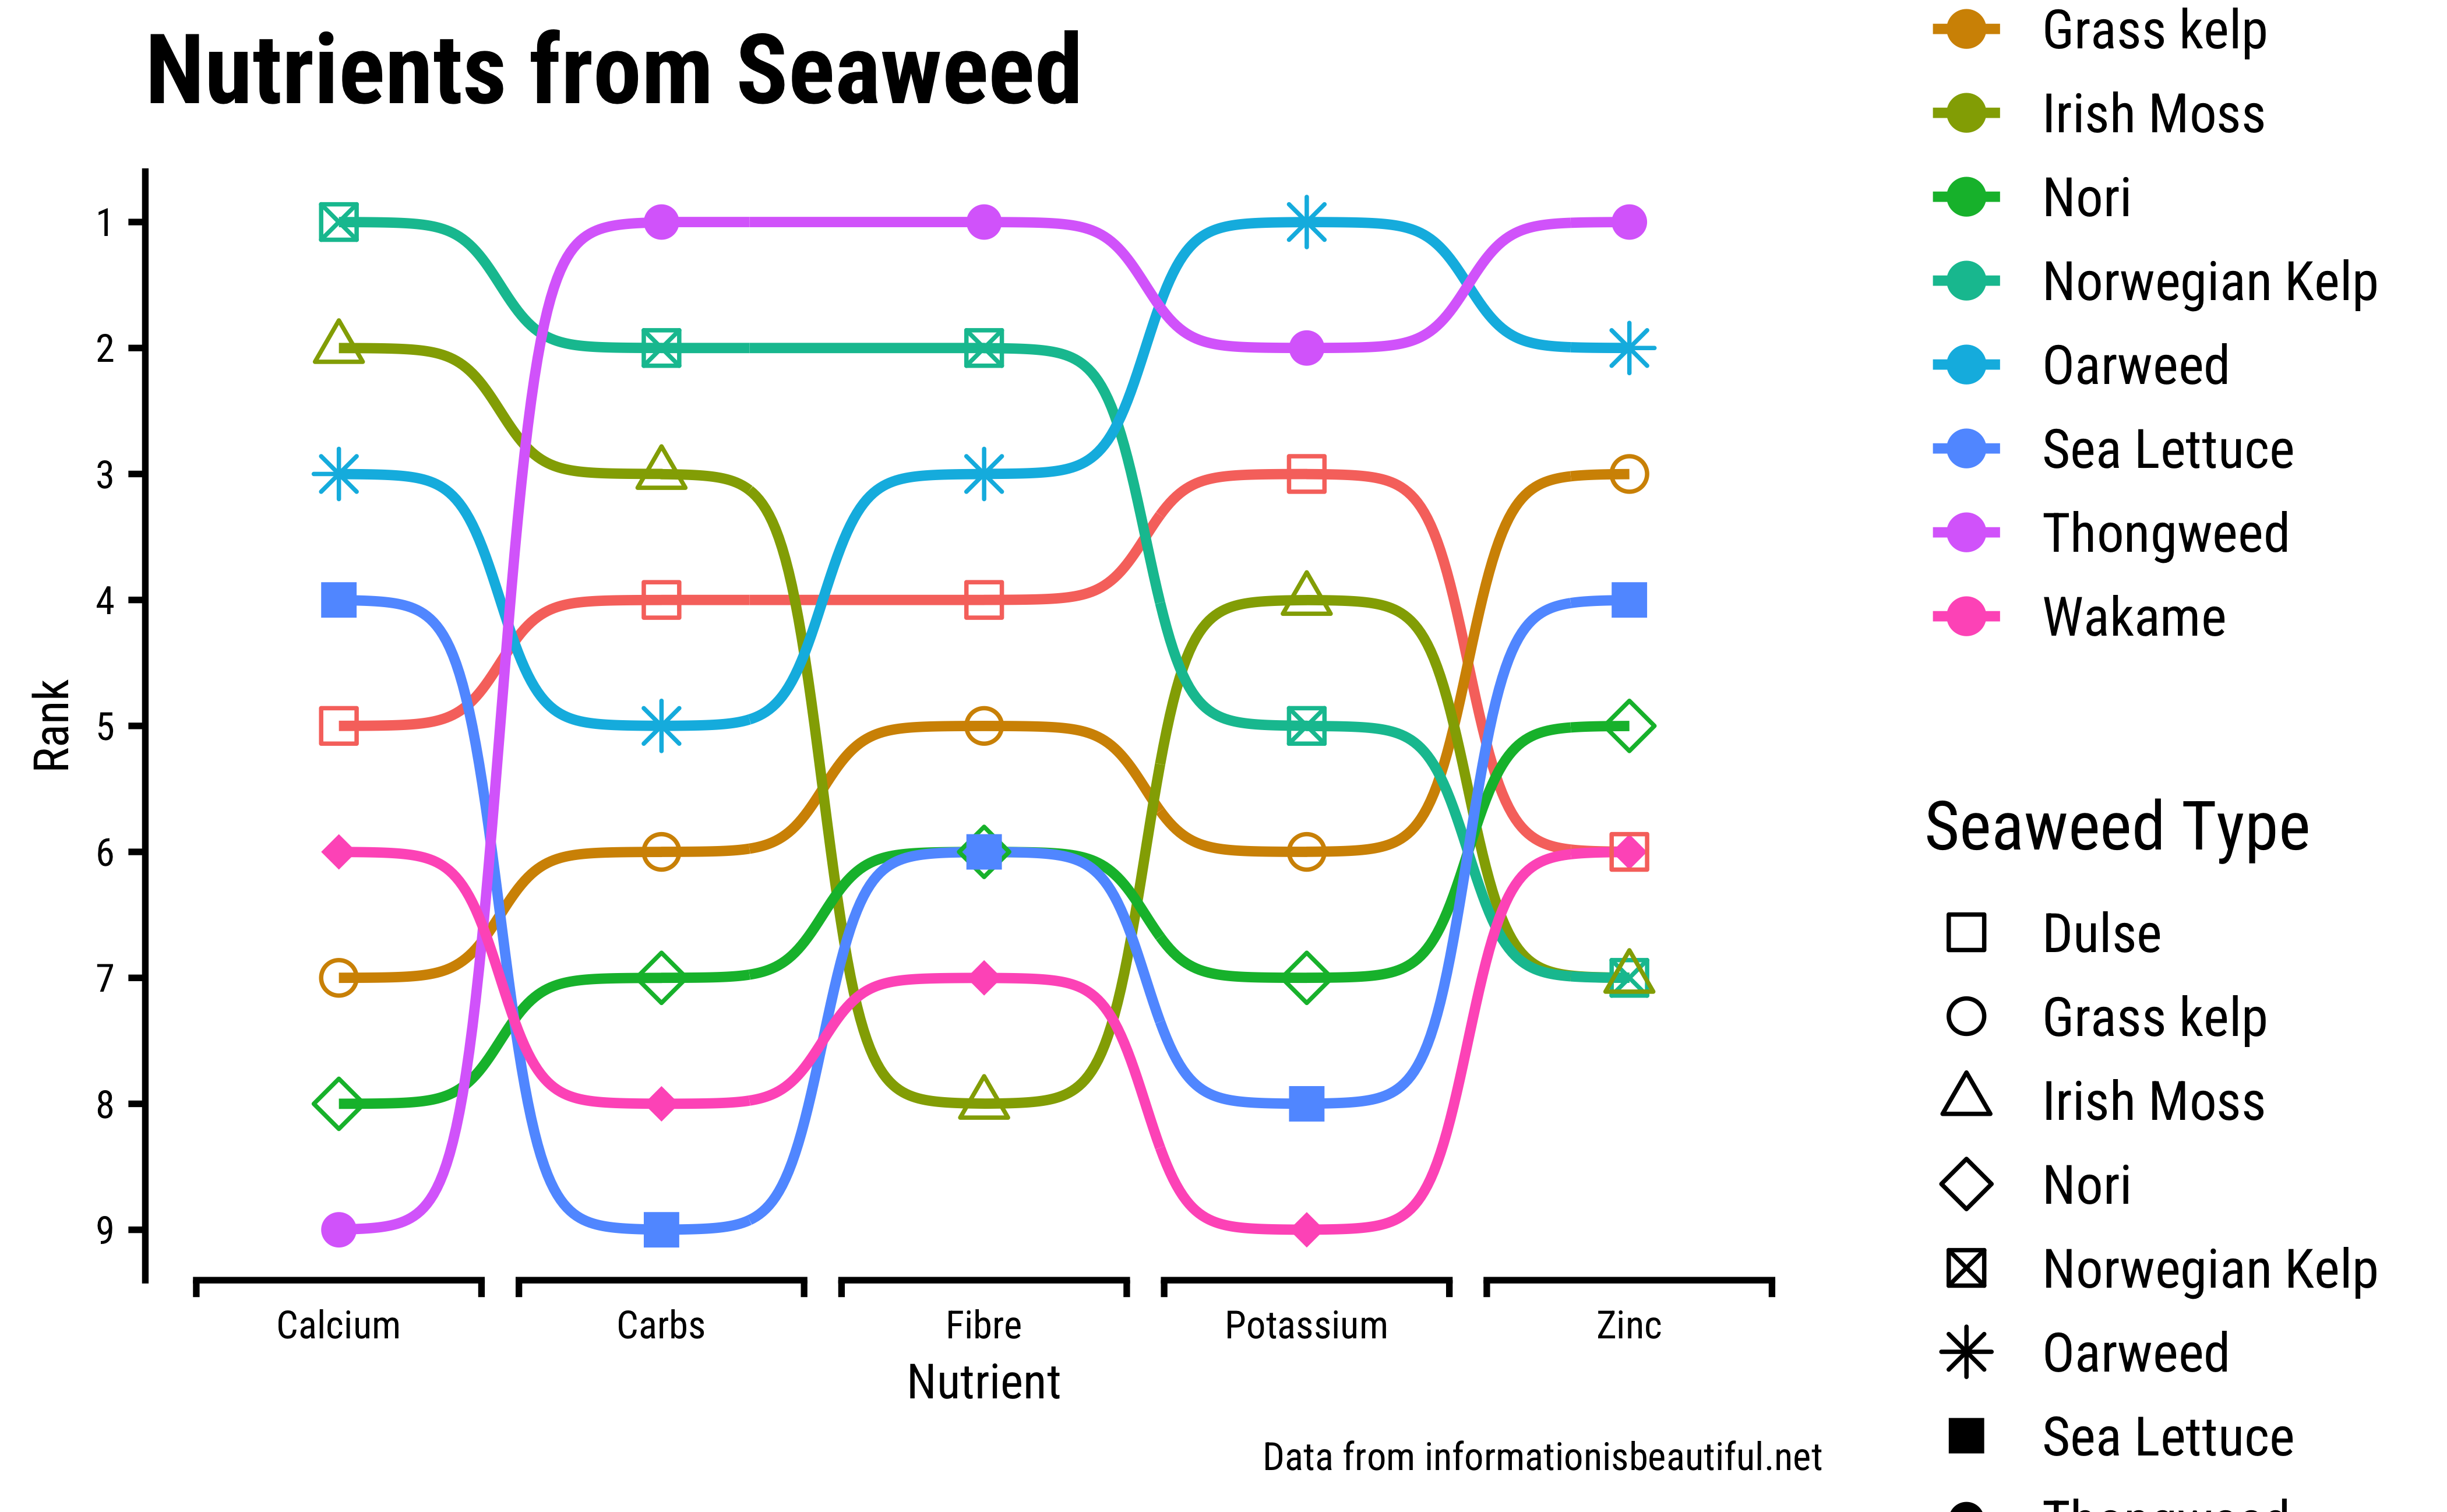
Nine types of Seaweed were rated on different parameters and charted as shown below.
NoteExcel Data
The data is an excel sheet. Inspect it first in Excel and decide which sheet you need, and which part of the data you need. There are multiple sheets! Then use readxl::read_xlsx(..) to read it into R.
3 Read the Data
4 Inspect the Data
Rows: 10
Columns: 18
$ `common name`     <chr> "RDA", "Norwegian Kelp", "Oarweed", "Thongweed", "Wa…
$ `sci-name`        <chr> NA, "-Ascophyllum nodosum", "-Laminaria digitata", "…
$ `total fats`      <chr> NA, "0.6", "-", "-", "0.6", "0.3", "-", "0.2", "-", …
$ `saturated fat`   <chr> NA, "0.2", "-", "-", "0.1", "0.1", "-", "0", "-", "-"
$ cholesterol       <chr> NA, "0", "0", "0", "0", "0", "0", "0", "0", "-"
$ protein           <chr> NA, "1.7", "-", "-", "3", "5.8", "-", "1.5", "-", "-"
$ `Total fiber`     <dbl> NA, 8.8, 6.2, 9.8, 3.4, 3.8, 5.4, 1.3, 3.8, 4.9
$ `Soluble fiber`   <chr> NA, "7.5", "5.4", "7.7", "2.9", "3", "3", "-", "2.1"…
$ `Insoluble fiber` <chr> NA, "1.3", "0.8", "2.1", "0.5", "1", "2.3", "-", "1.…
$ Carbohydrates     <dbl> NA, 13.1, 9.9, 15.0, 4.6, 5.4, 10.6, 12.0, 4.1, 7.8
$ Calcium           <dbl> NA, 575.0, 364.7, 30.0, 112.3, 34.2, 148.8, 373.8, 3…
$ Potassium         <dbl> NA, 765.0, 2013.2, 1351.4, 62.4, 302.2, 1169.6, 827.…
$ Magnesium         <dbl> NA, 225.0, 403.5, 90.1, 78.7, 108.3, 97.6, 573.8, 46…
$ Sodium            <dbl> NA, 1173.8, 624.6, 600.6, 448.7, 119.7, 255.2, 1572.…
$ Copper            <dbl> NA, 0.8, 0.3, 0.1, 0.2, 0.1, 0.4, 0.1, 0.3, 0.1
$ Iron              <dbl> NA, 14.9, 45.6, 5.0, 3.9, 5.2, 12.8, 6.6, 15.3, 22.2
$ Iodine            <dbl> NA, 18.2, 70.0, 10.7, 3.9, 1.3, 10.2, 6.1, 1.6, 97.9
$ Zinc              <chr> NA, "-", "1.6", "1.7", "0.3", "0.7", "0.3", "-", "0.…
5 Data Dictionary
NoteQuantitative Variables
Write in.
NoteQualitative Variables
Write in.
NoteObservations
Write in.
6 Research Question
Note
Write in!
7 Analyse/Transform the Data
```{r}
#| label: data-preprocessing
#
# Write in your code here
# to prepare this data as shown below
# to generate the plot that follows
```
8 Plot the Data
9 Tasks and Discussion
- Complete the Data Dictionary.
- Select and Transform the variables as shown.
- Create the graphs shown and discuss the following questions:
- Identify the type of charts
- Identify the variables used for various geometrical aspects (x, y, fill…). Name the variables appropriately.
- What research activity might have been carried out to obtain the data graphed here? Provide some details.
- What might have been the Hypothesis/Research Question to which the response was Chart?
- Write a 2-line story based on the chart, describing your inference/surprise.
- Based on the diagram, discuss which one an elderly person might try if they are deficient in calcium. If you were trying to avoid carbs, which seaweed sushi would you try?